Q1FY2020 Result Update | Banking
Jul 18, 2019
Yes Bank
NEUTRAL
CMP
`98.45
Provision remained elevated
Target Price
`-
Particulars (` cr)
Q 1FY20
Q 4FY19
% chg (qoq)
Q 1FY19
% chg (yoy)
Investment Period
12 Months
NII
2,281
2,506
(9)
2,219
3
Pre-prov. profit
1,959
1,323
48
2,455
(20)
PAT
114
(1,507)
-
1,260
(91)
Stock Info
Source: Company, Angel Research
Sector
Banking
Yes Bank reported a poor set of numbers for Q1FY2020. Slippages for the quarter
were `6,232cr, up 51.5% qoq. This led to a jump in GNPA to 5.01%, up 179bps
Market Cap (` cr)
22,829
qoq and 370bpsyoy. Sharp jump of 230bps in BB & below book to `29,470cr was
Beta
1.2
a disappointment and will likely keep the provisions exp higher for next few
52 Week High / Low
404 / 85
quarters.
Avg. Daily Volume
80,08,078
Loan growth moderates; NIM compressed to 2.8%: Loan book growth moderated
to 10% yoy (declined 2% qoq), of which retail book increased by 44% yoy to
Face Value (`)
2
constitute 18% of total advances. NIM compressed by 21bps/28bps qoq/yoy to
BSE Sensex
39,216
2.8% on account higher NPA recognition and increase in COF. Henceforth
Nifty
11,687
advances growth will primarily depend on capital raising as banks CET-1 stands at
Reuters Code
YESB.BO
8.04%.
Slippages, provisions continue to remain elevated: During the quarter, slippages
Bloomberg Code
YES@IN
were `6,232cr of which `1,680cr were technical slippages, thus net slippages
came in at `4,552cr. These net slippages were from BB & below book, `2,500cr
were from watchlist identified (`10,000cr) in Q4FY19, which is subset of BB &
Shareholding Pattern (%)
below book. Higher slippages led to higher GNPA to 5.01% i.e. 179bps/370bps
jump over qoq/yoy. Bigger concern was a sharp jump of 230bps in BB & below
Promoters
19.8
book to 9.7% primarily led by a downgrade in Yes Bank’s investment in bonds of
MF / Banks / Indian Fls
21.6
two NBFC (exposure worth of `7,500 for which bank now caries provision of
`1,500cr (`1,109 MTM and `400cr writeback) which is 20%).During the quarter,
FII / NRIs / OCBs
36.2
bank took provisions worth `1,784cr, of which MTM was `1,109cr on bonds due
to downgrades. Remaining `675cr was for advance provision. However, total
Indian Public / Others
22.5
provision for advance is ~`2,000cr as bank used `1,399cr as specific provision
from `2,100cr contingent made for identified stress book. Management has
guided credit cost of 1.25% for FY20E, however, it does not include MTM of
Abs. (%)
3m
1yr
3yr
investment book.
Treasury gain, contained Opex supported pre-provision profit: NII increased 3%
Sensex
0.2
7.8
41.3
yoy (declined 10% qoq) led by higher interest income reversals of `220cr and
compression in spreads. During the quarter, bank treasury gain of `450cr and
Yes Bank
(61.4)
(74.3)
(58.1)
contained operating expense helped to report healthy 48% qoq jump in pre-pro
profit and (declined 20% yoy)
Outlook & Valuation: We have a neutral view on Yes Bank, considering (a) low
CET of 8.04%; for growth, the bank will have to raise capital at current valuations,
which is dilutive, (b) uncertainty related to BB & below book performance, (c) any
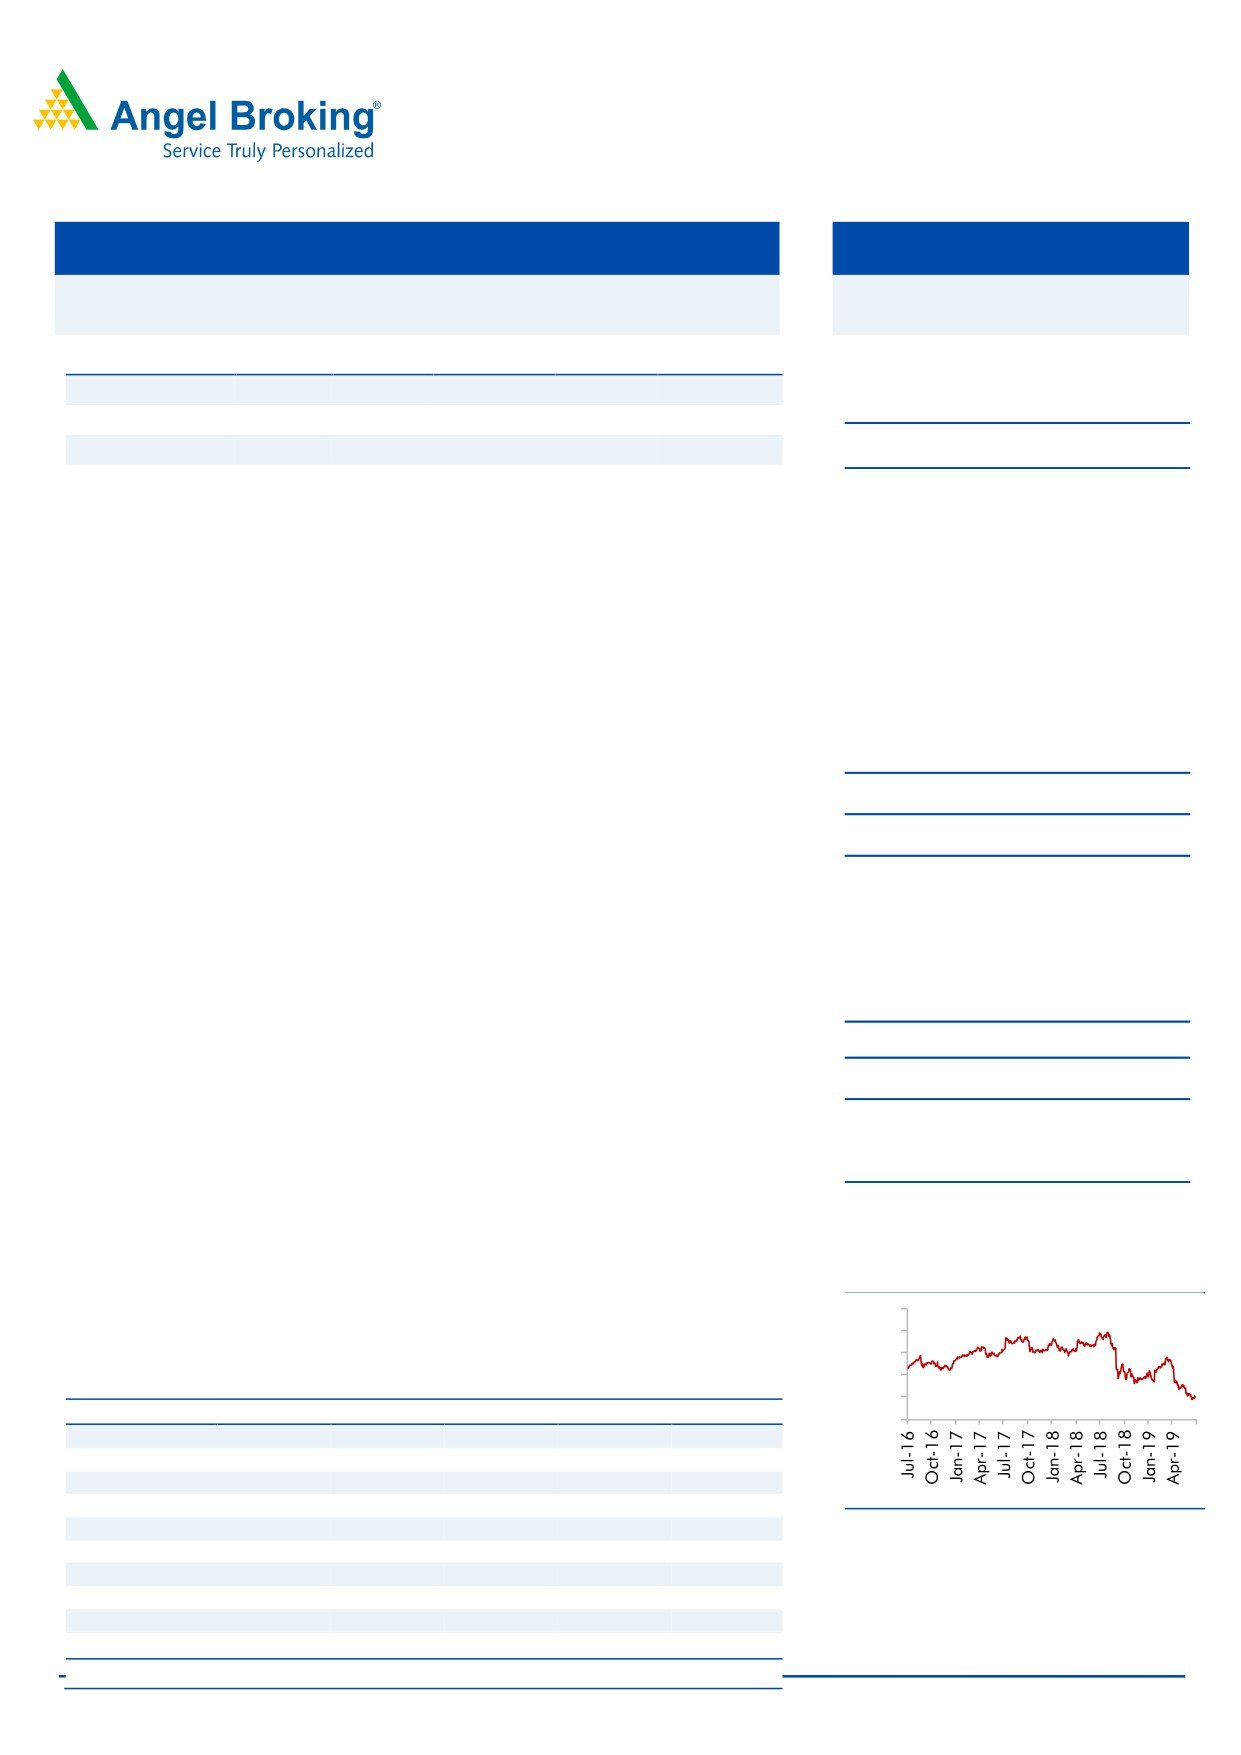
3-year price chart
fresh set of downgrade in investment/ advances will absorb CET-1 and will impact
500
growth. Hereon, the bank’s performance is more dependent on certain events viz.
400
resolution of some large exposure and capital raising, which is contingent.
300
200
Key financials (Standalone)
100
Y/E March (` cr)
F Y17
F Y18
F Y19E
F Y20E
F Y21E
0
NII
5,797
7,737
9,809
10,000
11,276
% chg
27
33
27
2
13
Net profit
3,330
4,225
1,720
1,325
2,798
% chg
31
27
(59)
(23)
111
Source: Company, Angel Research
NIM (%)
3.4
3.3
3.1
2.8
2.7
EPS ( Rs)
14
18
7
6
12
Jaikishan Parmar
P/E (x)
7
5
13
17
8
Research Analyst
P/ABV (x)
1.1
0.9
0.9
0.9
0.8
RoA (%)
1.8
1.6
0.5
0.3
0.6
022 - 39357600 Ext: 6810
R oE (%)
19
18
7
5
9
Source: Company, Angel Research, Note: CMP as of 17/07/19
Please refer to important disclosures at the end of this report
1
Yes Bank | Q1FY2020 Result Update
Exhibit 1: Q1FY2020 performance summary (standalone)
Particulars (` cr)
Q 3FY18
Q 4FY18
Q 1FY19
Q 2FY19
Q 3FY19
Q 4FY19
Q 1FY20
% chg (qoq)
% chg (yoy)
Interest Earne d
5,070
5,743
6,578
7,231
7,959
7,857
7,816
(1)
19
on Advances / Bills
3,846
4,404
5,005
5,550
6,248
6,120
6,106
(0)
22
on inve stments
1,098
1,179
1,351
1,561
1,604
1,533
1,539
0
14
on bal with RBI
82
110
162
58
42
136
104
(24)
(36)
on others
44
50
60
62
65
68
67
(1)
11
Interest Expended
3,182
3,589
4,359
4,814
5,293
5,351
5,535
3
27
Net Interest Income
1,889
2,154
2,219
2,418
2,666
2,506
2,281
(9)
3
Other Income
1,422
1,421
1,694
1,473
891
532
1,273
139
(25)
Retail Banking Fees
290
347
333
367
353
406
348
(14)
4
Corp Trade & cash
154
240
216
212
224
210
200
(5)
(8)
Corporate Banking Fees
243
644
683
668
472
(112)
61
(155)
(91)
Forex, DCM & Securities
723
178
460
222
(160)
11
656
5,865
43
Operating i ncome
3,311
3,575
3,913
3,891
3,557
3,038
3,554
17
(9)
Operating Expenses
1,309
1,440
1,459
1,525
1,567
1,714
1,594
(7)
9
Employee expe nse s
533
547
591
594
625
660
661
0
12
Other Opex
776
893
868
931
942
1,054
933
(12)
7
Pre Provision Profit
2,002
2,135
2,455
2,366
1,990
1,323
1,959
48
(20)
Provisions
421
400
626
940
550
3,662
1,784
(51)
185
PBT
1,580
1,736
1,829
1,427
1,440
(2,338)
175
(107)
(90)
Provision for Taxes
504
556
569
462
438
(832)
61
(107)
(89)
Tax rate
32
32
31
32
30
36
35
(2)
13
PAT
1,077
1,179
1,260
965
1,002
(1,507)
114
(108)
(91)
Balance sheet
Advance (` cr)
1,71,515
2,03,534
2,14,720
2,40,000
2,43,885
2,41,500
2,36,300
(2)
10
Deposit (` cr)
1,71,731
2,00,738
2,13,395
2,22,838
2,22,758
2,27,610
2,25,902
(1)
6
C/D Ratio (%)
1.00
1.01
1.01
1.08
1.09
1.06
1.05
(1.5)bp
4bp
CA (` cr)
22,604
28,826
28,333
25,941
29,538
28,500
24,800
(13)
(12)
SA (` cr)
42,685
44,351
46,598
49,339
44,579
46,753
44,300
(5)
(5)
CASA deposits (` cr)
65,289
73,176
74,930
75,279
74,117
75,253
69,100
(8)
(8)
CASA %
38
36
35
34
33
33
31
(247.4)bp
(452.5)bp
CAR (%)
20
18
17
16
17
17
16
(80)bp
(120)bp
Tier 1 CAR (%)
15
13
13
12
12
11
11
(60)bp
(210)bp
Source: Company, Angel Research
July 18, 2019
2
Yes Bank | Q1FY2020 Result Update
Exhibit 2: Profitability ratio remain compressed
Profitability Ratios (%)
Q 3FY18
Q 4FY18
Q 1FY19
Q 2FY19
Q 3FY19
Q 4FY19
Q 1FY20 % chg (qoq) % chg (yoy)
Cost of funds
5.9
5.7
6.1
6.2
6.5
6.4
6.7
26.4bp
54.5bp
Reported NIM
3.5
3.4
3.3
3.3
3.3
3.1
3
(30)bp
(50)bp
Cost-to-income ratio
39.5
40.3
37.3
39.2
44.0
56.4
45
(1156.5)bp
759.6bp
Asset quality
Gross NPAs (` cr)
2,974
2,626
2,824
3,866
5,158
7,882
12,092
Gross NPAs (%)
1.7
1.3
1.3
1.6
2.1
3.2
5.0
179bp
370bp
Net NPAs (` cr)
1,595
1,312
1,262
2,019
2,876
4,484
6,883
Net NPAs (%)
0.9
0.6
0.6
0.8
1.2
1.9
2.9
105bp
232bp
PCR (%)
46.4
50.0
55.3
47.8
44.2
43.1
43.1
(2.7)bp (1222.1)bp
Slippage ratio (%)
0.3
0.2
0.3
0.7
0.9
1.4
2.6
119.6bp
237.7bp
Credit Cost on Adv (Annl)
1.0
0.8
1.2
1.6
0.9
6.1
3.0
(304.5)bp
185.5bp
Exhibit 3: Asset Quality deteriorated led by higher slippages (Two NBFC Bond fall into BB & below book)
A sset Q uality
Q 2FY18 Q 3FY18 Q 4FY18 Q 1FY19 Q 2FY19 Q 3FY19 Q 4FY19 Q 1FY20
% qoq
% yoy
Gross NPA (` cr)
2,720
2,974
2,627
2,824
3,866
5,159
7,883
12,092
52.8
200.1
Net NPA (` cr)
1,543
1,595
1,313
1,263
2,019
2,876
4,485
6,883
55.9
241.6
Gross NPA %
1.82
1.72
1.28
1.31
1.60
2.10
3.22
5.01
179bp
370bp
Net NPA %
1.04
0.93
0.64
0.59
0.84
1.18
1.86
2.91
105bp
232bp
Provision Coverage%
43.3
46.4
50.0
55.3
47.78
44.24
43.11
43.08
(2.7)bp (1222.1)bp
Restructured Advances %
0.08
0.05
0.04
0.00
0.08
0.09
0.08
0.08
0bp
7.9bp
Security Receipt (Net) %
0.94
1.06
0.92
0.82
0.85
0.71
0.71
0.71
0bp
(11)bp
Standard SDR
0.32
0.21
-
-
0bp
0bp
5:25 Re financi ng
0.15
0.06
0.05
0.05
0bp
(5)bp
S4A/BBB
0.01
0.09
0.07
0.07
0bp
(7)bp
New Indentifieds Stressed asset
4.14
3.17
(96.7)bp
317.4bp
Total Stressed asset
2.54
2.40
1.72
1.53
1.77
1.98
6.79
6.87
8.3bp
534.3bp
Source: Company, Angel Research
Exhibit 4: Sequentially Corporate Rating Profile deteriorated
A dvance Rating (%)
Q 2FY18
Q 3FY18
Q 4FY18
Q 1FY19
Q 2FY19
Q 3FY19
Q 4FY19
Q 1FY20
% chg (qoq)
% chg (yoy)
AAA
19.7
22
23.2
22.2
21.3
21
22.3
20.5
(180)bp
(170)bp
AA
14.8
13.4
13.3
13.5
15.1
13.3
13.3
11.6
(170)bp
(190)bp
A
41
42.8
42.9
43.2
42.8
43
42.3
41.3
(100)bp
(190)bp
BBB
21.5
19
18.5
18.7
18.3
20.3
14.9
17.2
230bp
(150)bp
BB & B
2.9
2.8
2.2
2.3
2.4
2.5
7.1
9.4
230bp
710bp
Total
100
100
100.1
100
100
100
100
100
Source: Company, Angel Research
July 18, 2019
3
Yes Bank | Q1FY2020 Result Update
Income statement
Y/E March (` cr)
F Y17
F Y18
F Y19
F Y20E
F Y21E
Net Interest Income
5,797
7,737
9,809
10,000
11,276
- YoY Growth (%)
27
33
27
2
13
Other Income
4,157
5,224
4,590
3,840
4,361
- YoY Growth (%)
53
26
(12)
(16)
14
Operating Income
9,954
12,961
14,399
13,840
15,637
- YoY Growth (%)
37
30
11
(4)
13
Operating Expenses
4,117
5,213
6,264
7,263
8,351
- YoY Growth (%)
38
27
20
16
15
Pre - Provision Profit
5,838
7,748
8,135
6,576
7,287
- YoY Growth (%)
36
33
5
(19)
11
Prov. & Cont.
793
1,554
5,778
4,598
3,111
- YoY Growth (%)
48
96
272
(20)
(32)
Profit Before Tax
5,044
6,194
2,357
1,978
4,176
- YoY Growth (%)
34
23
(62)
(16)
111
Prov. for Taxation
1,714
1,970
637
653
1,378
- as a % of PBT
34
32
27
33
33
PAT
3,330
4,225
1,720
1,325
2,798
- YoY Growth (%)
31
27
(59.28)
(23)
111
Balance sheet
Y/E March (` cr)
F Y17
F Y18
F Y19
F Y20E
F Y21E
Equity
456
461
463
463
463
Reserve & Surplus
21,598
25,298
26,441
27,700
30,358
Net worth
22,054
25,758
26,904
28,163
30,821
Deposits
1,42,874
2,00,738
2,27,610
2,61,467
3,01,762
- Growth (%)
28
41
13
15
15
Borrowings
38,607
74,894
1,08,424
1,20,351
1,37,200
Other Liab. & Prov.
11,525
11,056
17,888
15,635
18,670
Total Liabilities
2,15,060
3,12,446
3,80,826
4,25,615
4,88,454
Cash Balance s
6,952
11,426
10,798
15,895
18,305
Bank Balances
12,597
13,309
16,092
18,340
21,121
Investments
50,032
68,399
89,522
95,370
1,09,830
A dvances
1,32,263
2,03,534
2,41,500
2,70,480
3,11,051
- Growth (%)
35
54
19
12
15
Fixed Assets
684
832
817
1,223
1,408
Other Assets
12,532
14,946
22,098
24,308
26,739
Total Assets
2,15,060
3,12,446
3,80,826
4,25,615
4,88,454
- Growth (%)
30
45
22
12
15
July 18, 2019
4
Yes Bank | Q1FY2020 Result Update
Ratio analysis
Y/E March (` cr)
F Y16
F Y17
F Y18
F Y19
F Y20E
F Y21E
Profitability ratios (%)
NIMs
3.3
3.4
3.3
3.1
2.8
2.7
Cost to Income Rati o
40.9
41.4
40.2
43.5
52.5
53.4
RoA
1.7
1.8
1.6
0.5
0.3
0.6
RoE
19.9
18.6
17.7
6.5
4.8
9.5
B/S ratios (%)
CASA Ratio
0.28
0.36
0.36
0.33
0.33
0.33
Credit/Deposit Ratio
0.9
0.9
1.0
1.1
1.0
1.0
A sset Q uality (%)
Gross NPAs
0.76
1.52
1.28
3.22
4.50
3.50
Gross NPAs (` cr)
749
2,019
2,627
7,883
12,172
10,887
Net NPAs
0.29
0.81
0.64
1.86
2.30
1.50
Net NPAs (` cr)
284
1,072
1,313
4,485
6,221
4,666
Credit Cost on Advance
0.55
0.60
0.76
2.39
1.70
1.00
Provision Coverage
62%
47%
50%
43%
49%
57%
Per Share Data (`)
EPS
11.0
14.5
18.3
7.5
5.8
12.1
BV
59.9
95.8
111.8
116.8
122.3
133.8
ABVPS (75% cover.)
59.6
93.7
109.6
107.6
111.1
127.8
DPS
2.0
2.4
2.7
1.3
0.3
0.6
Valuati on Ratios
PER (x)
8.9
6.8
5.4
13.2
17.1
8.1
P/BV
1.6
1.0
0.9
0.8
0.81
0.74
P/ABVPS (x)
1.7
1.1
0.9
0.9
0.89
0.77
Dividend Yield
2.0
2.4
2.7
1.4
0.3
0.6
Note - Valuation done on closing price of 17/07/2019
July 18, 2019
5
Yes Bank | Q1FY2020 Result Update
Research Team Tel: 022 - 39357800
Angel Broking Limited (hereinafter referred to as “Angel”) is a registered Member of National Stock Exchange of India Limited, Bombay
Stock Exchange Limited, Metropolitan Stock Exchange Limited, Multi Commodity Exchange of India Ltd and National Commodity &
Derivatives Exchange Ltd It is also registered as a Depository Participant with CDSL and Portfolio Manager and Investment Adviser with
SEBI. It also has registration with AMFI as a Mutual Fund Distributor. Angel Broking Limited is a registered entity with SEBI for Research
Analyst in terms of SEBI (Research Analyst) Regulations, 2014 vide registration number INH000000164. Angel or its associates has not
been debarred/ suspended by SEBI or any other regulatory authority for accessing /dealing in securities Market. Angel or its
associates/analyst has not received any compensation / managed or co-managed public offering of securities of the company covered
by Analyst during the past twelve months.
This document is solely for the personal information of the recipient, and must not be singularly used as the basis of any investment
decision. Nothing in this document should be construed as investment or financial advice. Each recipient of this document sho uld
make such investigations as they deem necessary to arrive at an independent evaluation of an inv estment in the securities of the
companies referred to in this document (including the merits and risks involved), and should consult their own advisors to de termine
the merits and risks of such an investment.
Reports based on technical and derivative analysis center on studying charts of a stock's price movement, outstanding positions and
trading volume, as opposed to focusing on a company's fundamentals and, as such, may not match with a report on a company's
fundamentals. Investors are advised to refer the Fundamental and Technical Research Reports available on our website to evaluate the
contrary view, if any
The information in this document has been printed on the basis of publicly available information, internal data and other rel iable
sources believed to be true, but we do not represent that it is accurate or complete and it should not be relied on as such, as this
document is for general guidance only. Angel Broking Limited or any of its affiliates/ group companies shall not be in any wa y
responsible for any loss or damage that may arise to any person from any inadvertent error in the information contained in this report.
Angel Broking Limited has not independently verified all the information contained within this document. Accordingly, we cann ot testify,
nor make any representation or warranty, express or implied, to the accuracy, contents or data contained within this document. While
Angel Broking Limited endeavors to update on a reasonable basis the information discussed in this material, there may be regulatory,
compliance, or other reasons that prevent us from doing so.
This document is being supplied to you solely for your information, and its contents, information or data may not be reproduc ed,
redistributed or passed on, directly or indirectly.
Neither Angel Broking Limited, nor its directors, employees or affiliates shall be liable for any loss or damage that may ari se from or in
connection with the use of this information.
Disclosure of Interest Statement
Yes Bank
1. Financial interest of research analyst or Angel or his Associate or his relative
No
2. Ownership of 1% or more of the stock by research analyst or Angel or associates or relatives
No
3. Served as an officer, director or employee of the company covered under Research
No
4. Broking relationship with company covered under Research
No
July 18, 2019
6